Campaign analysis with R's Shiny
Campaign analysis–a technique for understanding the outcomes of military operations–is an important tool for scholars of security studies. As Rachel Tecott and I argue in our International Security article, campaign analysis involves specifying a model of a particular military operation, and a set of inputs that the model uses to generate outputs. The combination of model and inputs allows analysts to understand the likely outcomes of a military operation and to understand the role of each input in determining those outcomes.
Specifying a model is an exercise in applying theory and past experience to understanding a military operation. But specifying inputs can be a challenge. Because military operations are complex and unique, and some kinds of operations are (thankfully) rare or nonexistent, it can be difficult to know what inputs to use in a campaign analysis.
In our paper, we make two suggestions for how to address this challenge. First, we suggest that analysts should use a range of inputs, rather than a single point estimate. By sampling from a range of possible inputs, analysts can understand the distribution of possible outcomes, rather than just the most likely outcome. Second, we suggest that analysts present their model and inputs in an interactive format, so that other analysts can understand the model and inputs, and can explore the implications of different inputs for the model’s outputs. In many cases, a reader might believe the foundational model behind a campaign analysis, but not agree with the inputs that the analyst has chosen. By allowing the reader to explore the model and inputs, the analyst can make their analysis more transparent and more persuasive.
As part of our paper, we replicated and extended three existing campaign analyses: Lieber and Press’s (2006) analysis of a U.S. nuclear first strike on Russia, Barry Posen’s (1991) analysis of a Warsaw Pact invasion of Western Europe, and Wu Riqiang’s (2020) analysis of a U.S. first strike on Chinese nuclear forces.
We used R’s Shiny package to create interactive web applications that allow users to explore the models and inputs of these three campaign analyses. In each app, users can adjust the inputs to the model and see how the outputs change. This allows users to understand the implications of different inputs for the model’s outputs, and to explore the distribution of possible outcomes.
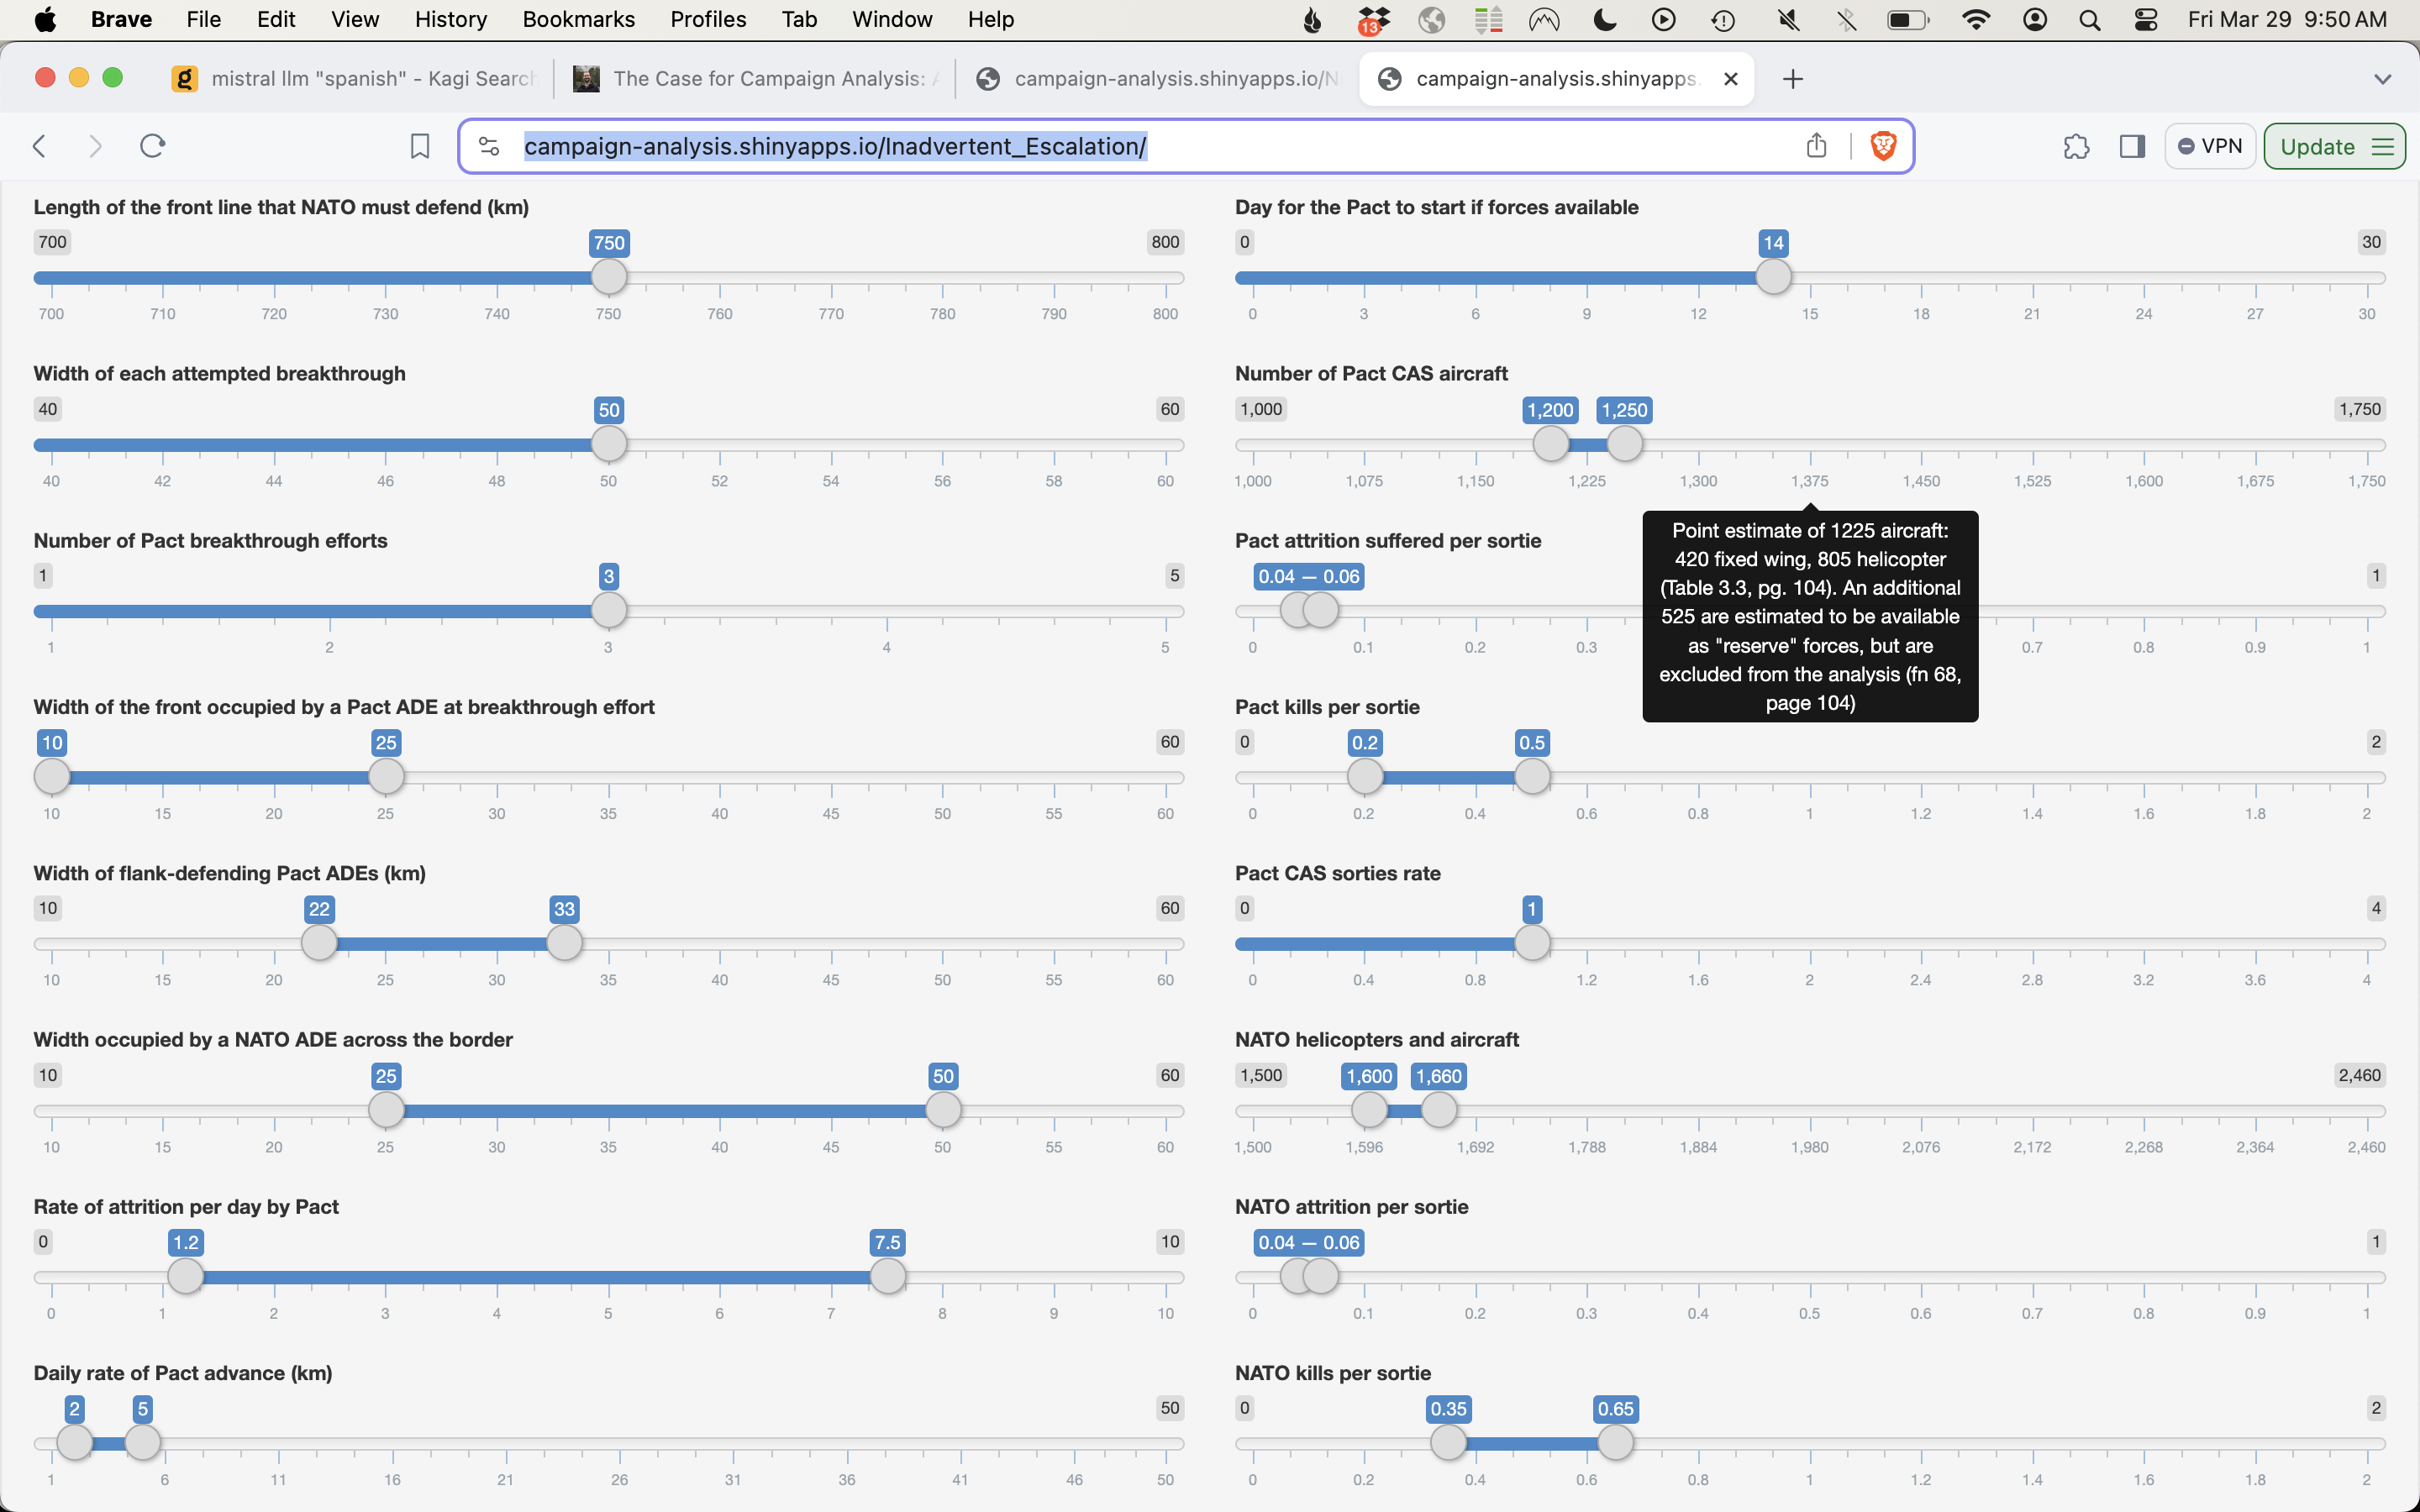
For instance, we can change the inputs to Posen’s model of a Warsaw Pact invasion of Western Europe to see how different assumptions about the balance of forces between NATO and the Warsaw Pact affect the likelihood of a successful Warsaw Pact invasion (i.e., a breakthrough of NATO lines). The figure below shows the inputs to Posen’s model, including now ranges of inputs.

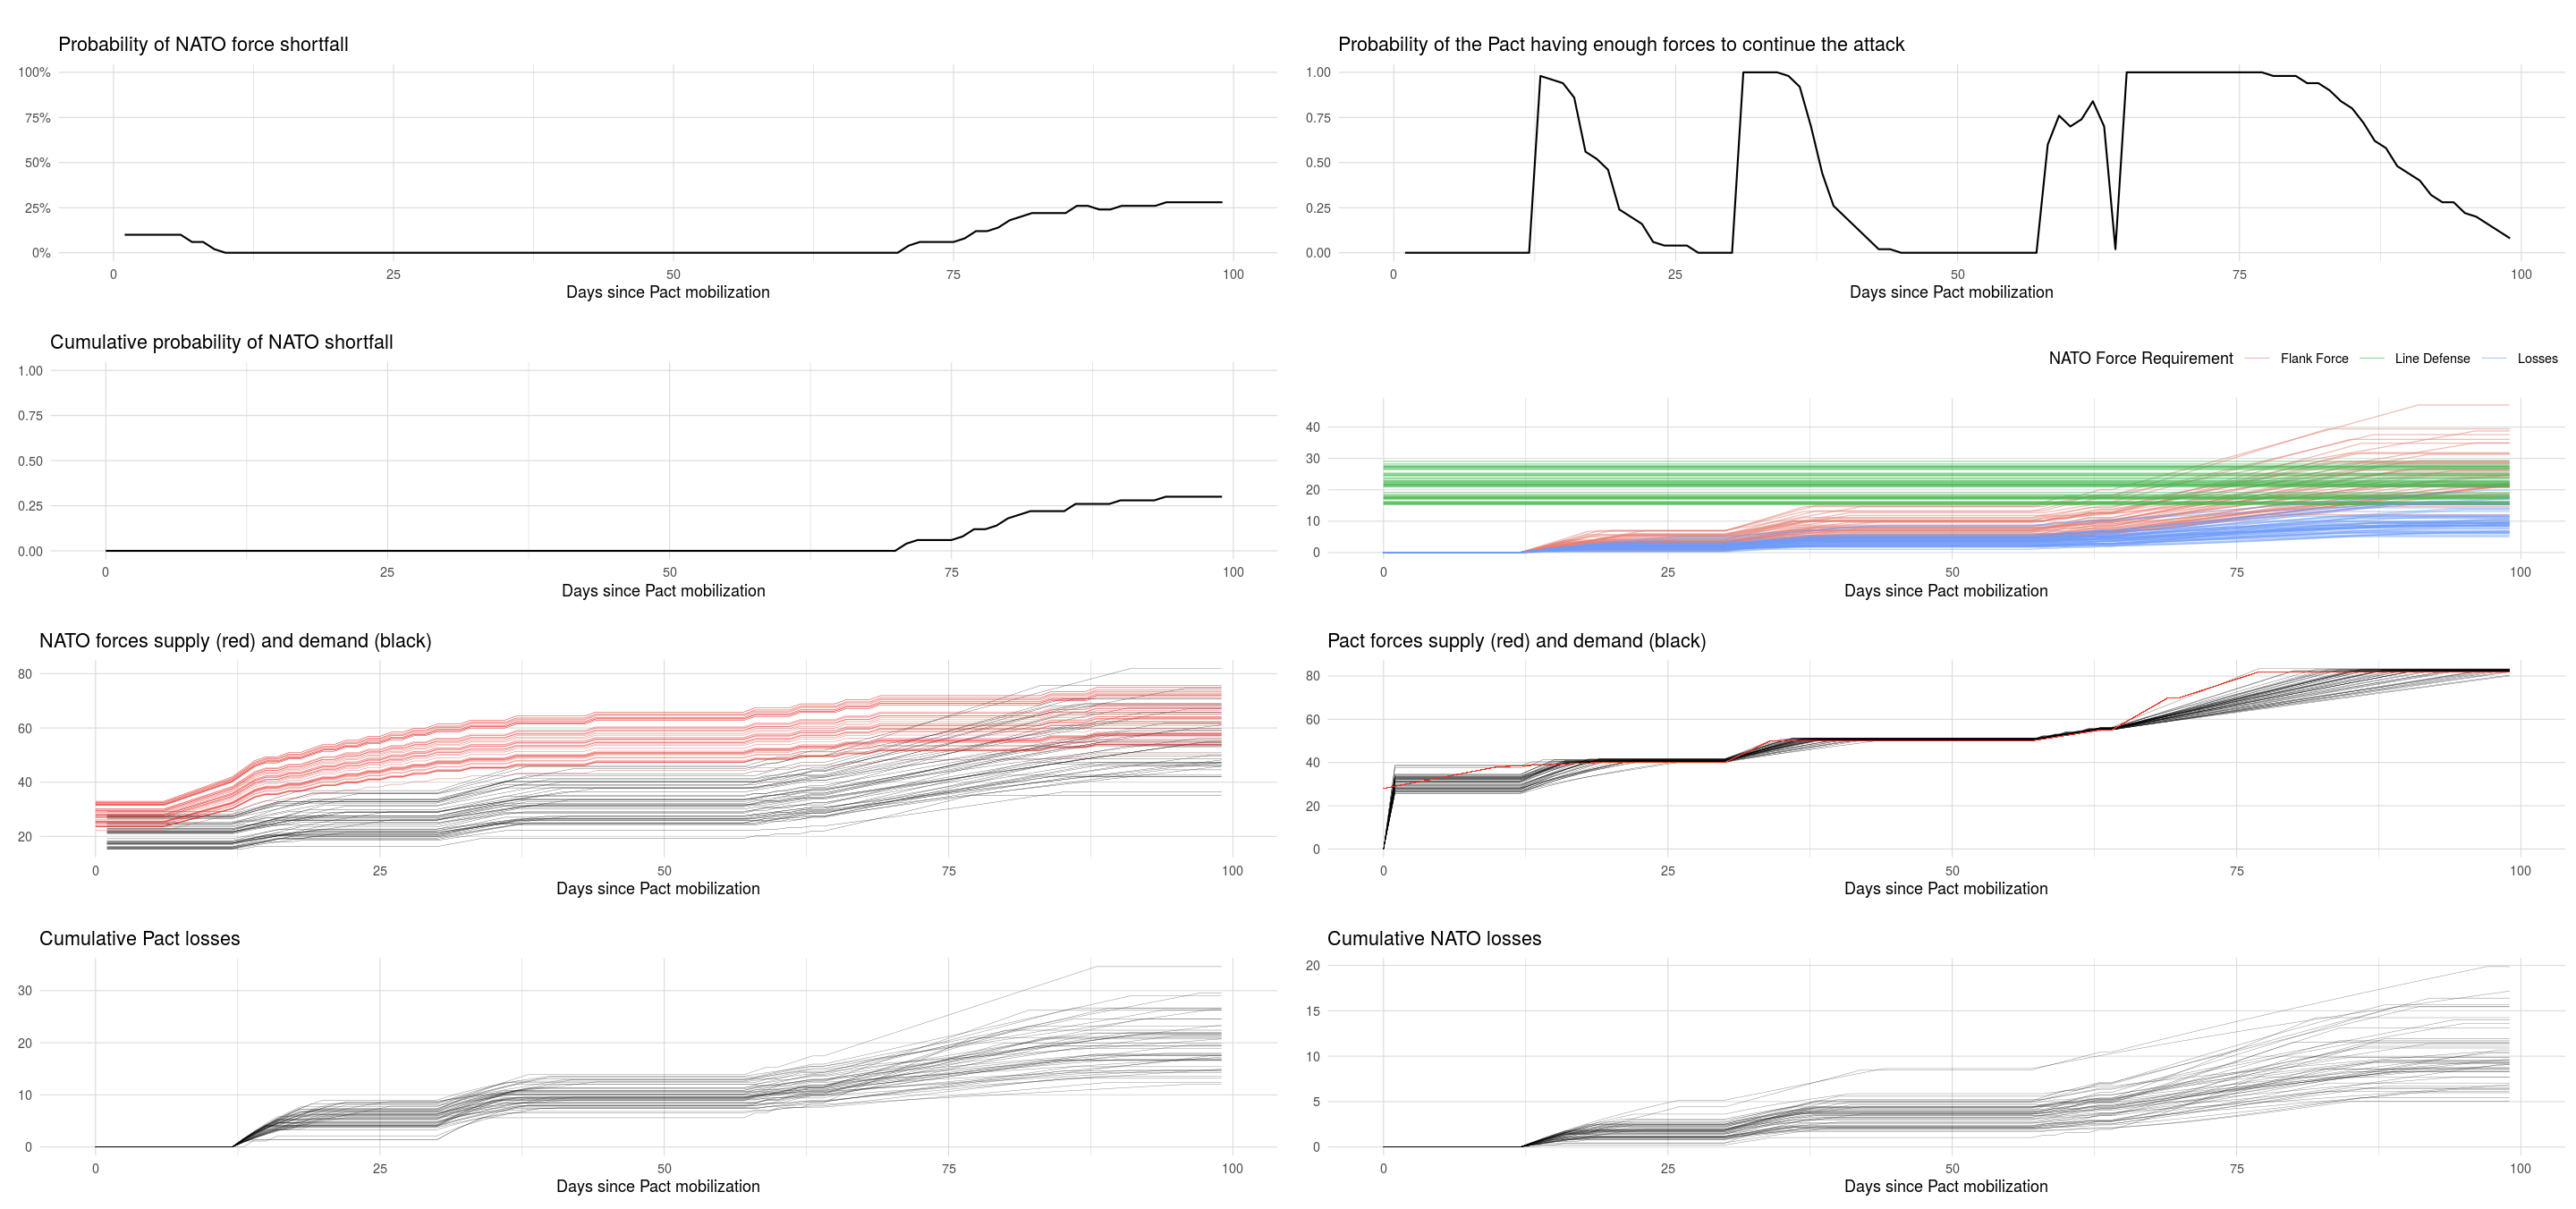
Then we can see the outputs of the model, with each line representing the results of a different sample of the inputs. By averaging across the samples, we can compute the probability of a successful invasion, given the uncertainty in our inputs:

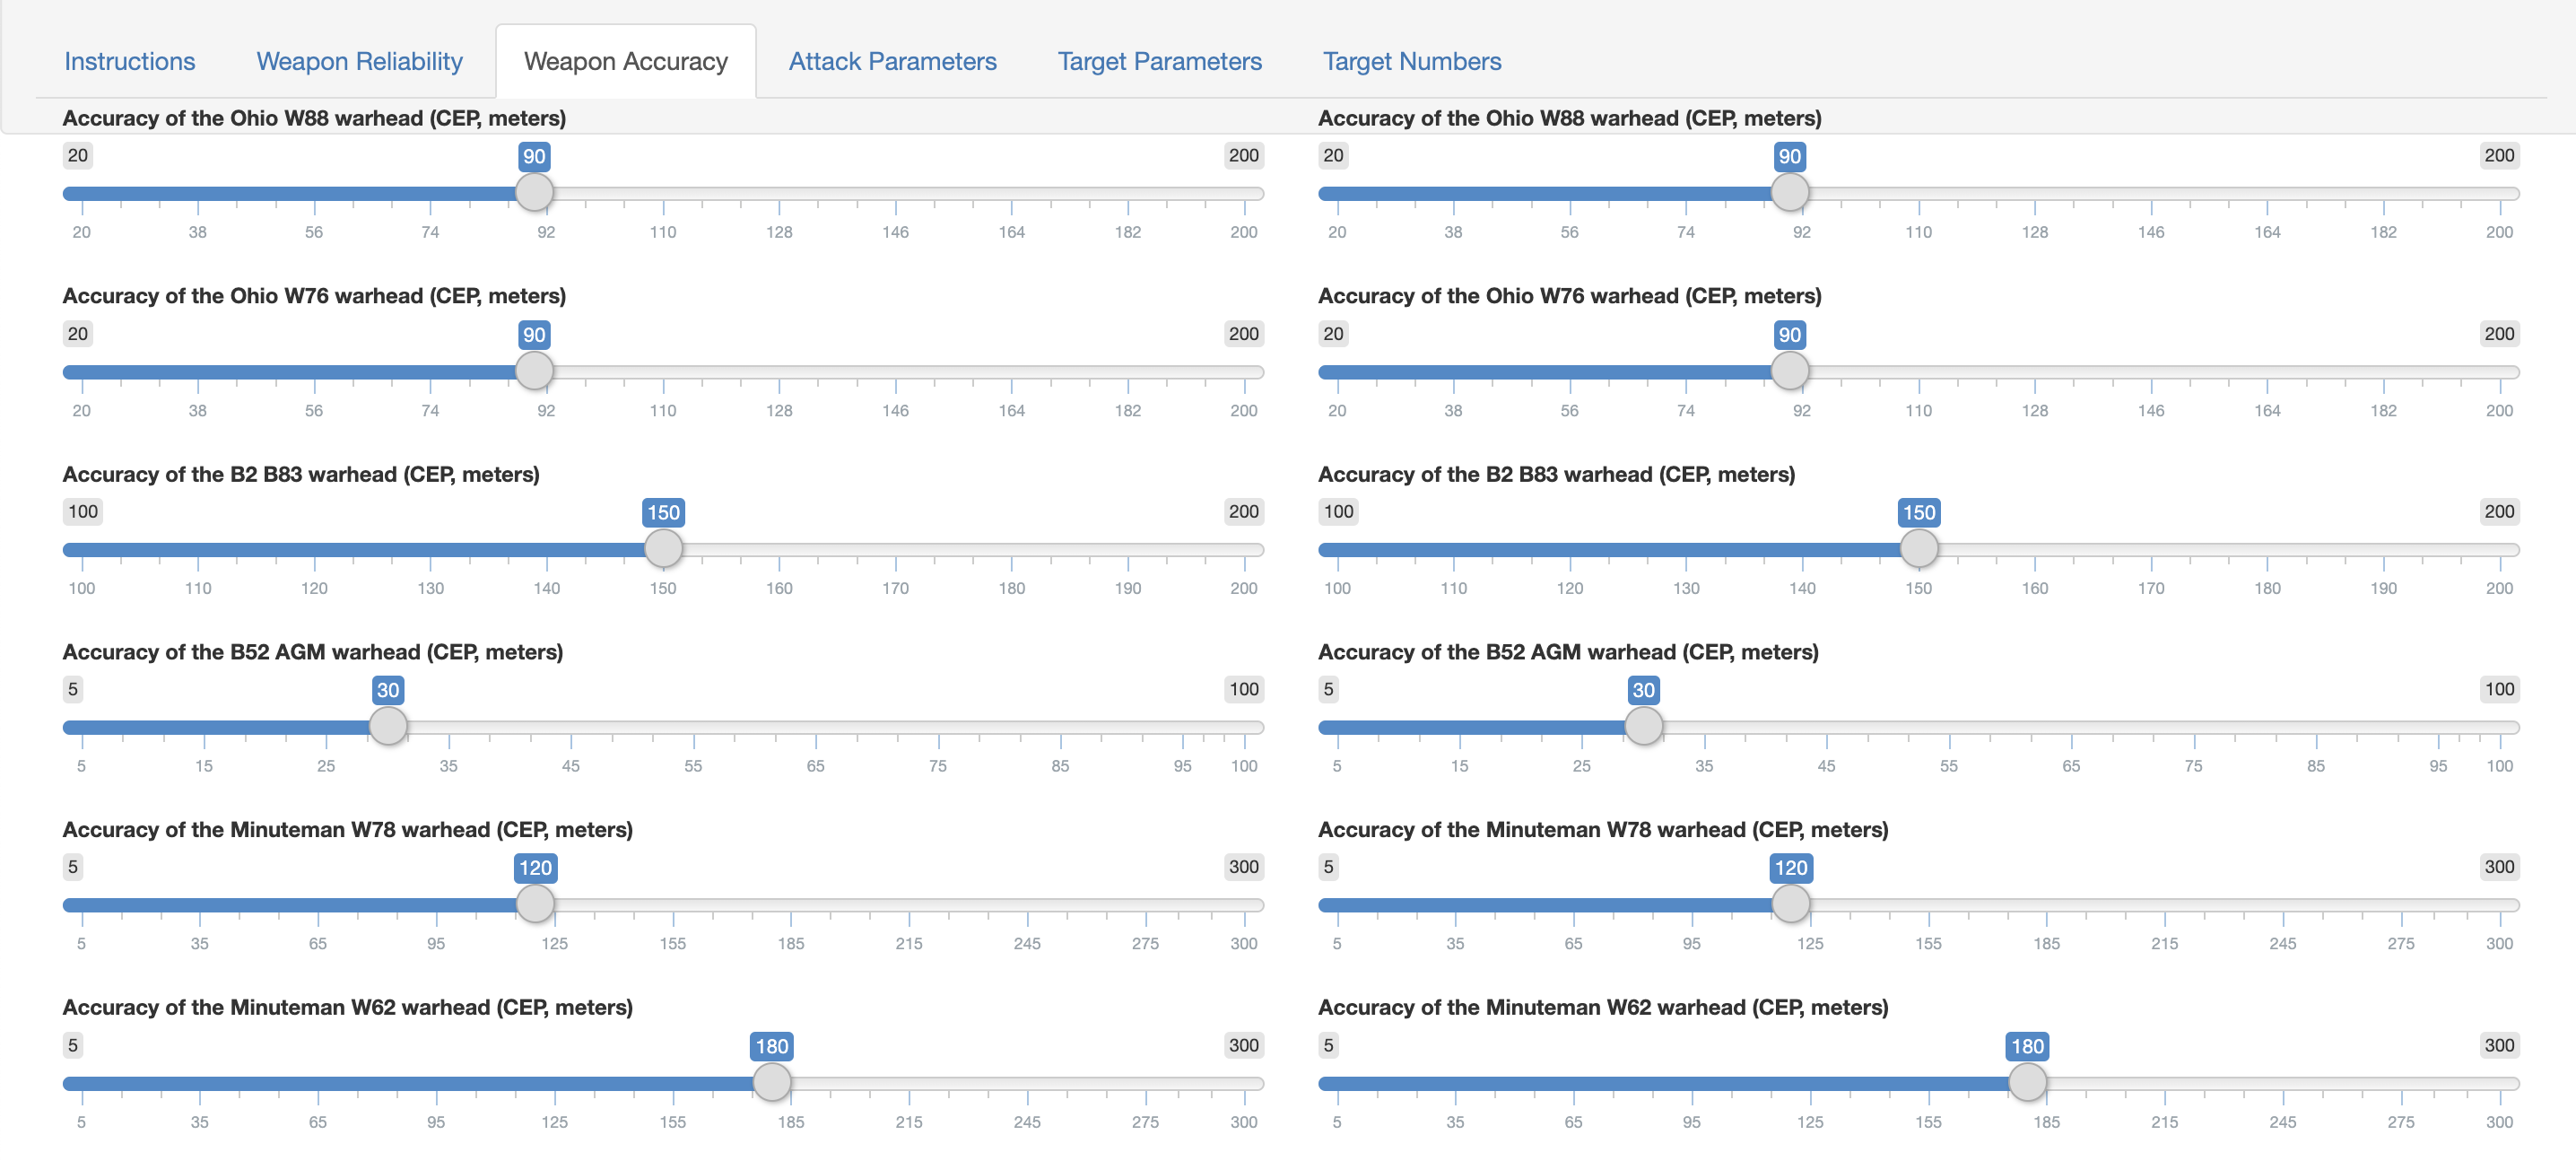
Similarly, we can explore the implications of different inputs for Lieber and Press’s model of a U.S. nuclear first strike on Russia. The success of a U.S. first strike depends on many factors, including the (classified) accuracy of each warhead. Allowing a reader to vary the accuracy of each warhead can help them understand the implications of different assumptions for the success of a U.S. first strike:

The three apps are available at the following links:
- https://campaign-analysis.shinyapps.io/Nuclear_Counterforce/
- https://campaign-analysis.shinyapps.io/Inadvertent_Escalation/
- https://campaign-analysis.shinyapps.io/Merits_of_Uncertainty/
All of the code for the three Shiny apps can be found in my GitHub repository.